
Is form taken seriously in the media discussion of football? Every game preview acknowledges the results from a team’s last five games, often with green, grey, and red blobs so you can see how much they’ve won, drawn, and lost recently… but it’s rarely quantified beyond that. This is kind of understandable, since you get three points for a win regardless of what form you or your opposition have been in, but I feel like a bit more of a deep dive into form data is needed.
I’ve been scraping a lot of game data from last season’s Premier League with the ultimate goal of making an adjusted table for rolling form. Which teams beat form teams most often? Which teams benefited most from playing teams at a low ebb more often than other teams? Is rolling form a better predictor of a match winner than a team’s position?
This has thrown up an absolute glut of data that can (and will) fill several blog posts. For now, though, I’d like to focus on Arsenal’s woes last season.
One of the main media narratives around Arsenal is that they’re flat track bullies; they swat aside mediocre teams with ease, looking fluent and impressive while doing so, but they come unstuck against the top teams. These criticisms extend to the individual players, with Olivier Giroud and Per Mertesacker often held up as examples of almost-but-not-quite players; good enough to beat most teams, but not in the elite level that would take Arsenal past the Chelseas, the Manchester Uniteds, the Manchester Citys (despite finishing above all of them last season, but whatever).
Thing is, that’s completely untrue.
Here’s a graph of Arsenal’s wins, losses, and draws last season. The dots and lines represent each game, and are positioned on the y-axis according to Arsenal’s and their opposition’s form over the last five games (in mean points per game) just before each game. This excludes the first five matches of the season, which are always a bit dicey and rarely reflect the final standings.

What strikes me most clearly is that Arsenal lost all their games to teams in average to poor form. Indeed, three losses were against teams who’d been averaging less than a point per game, which, if applied to a whole season, would set them out as clear relegation candidates. Moreover, around half these losses have come when Arsenal have been in a good run of form themselves, averaging two or more points per game (which, if applied to a whole season, would have seen them score 76 points, five more than they actually managed). Meanwhile, a lot of Arsenal’s wins actually came against teams who were doing well, averaging 1.5 points per game or more. This suggests that Arsenal were winning the difficult games and losing the easy games.
This isn’t much use on its own, so let’s look at Leicester and Tottenham for comparison.

Not only did Leicester lose less often – obviously – their losses never came against teams averaging less than one point per game. The same goes for Tottenham, who lost their games to teams in a fairly decent run of form.
We can also look at how Arsenal did according to their league position and the league position of their opposition just before the game.
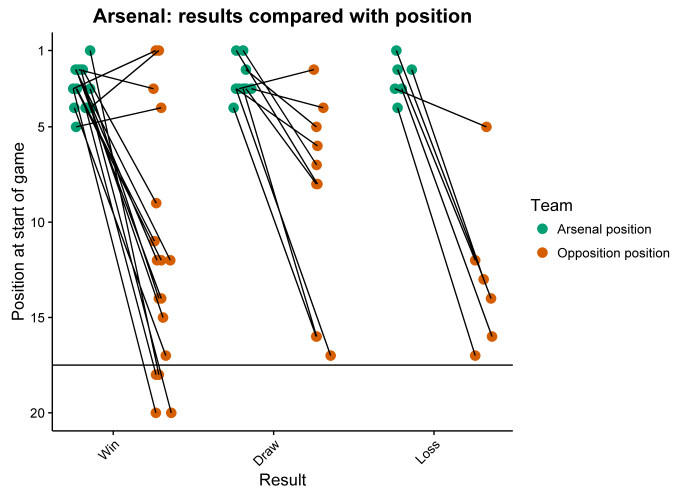
This plot is also pretty illuminating. The bulk of Arsenal’s losses came against teams in the bottom half of the table, while a lot of their record against teams in the top five when they played them was actually pretty good, winning four, drawing three, and losing only one. There’s also a nice split between their wins and draws which shows that Arsenal generally beat the lower table teams and generally drew with the high mid-table teams when they played them.
Again, let’s compare that with Leicester and Tottenham.


Leicester only lost to teams in the top half of the table. Tottenham lost to teams in the relegation zone twice, but the rolling form plot showed that these relegation zone teams had been doing pretty well at the time.
To get a look at the whole league, we can plot the mean rolling form and the mean league position for the opposition for each team in losses. That’s a confusing sentence; another way of phrasing it is saying that this is looking at the average form and average league position of the teams that each team lost to last season.
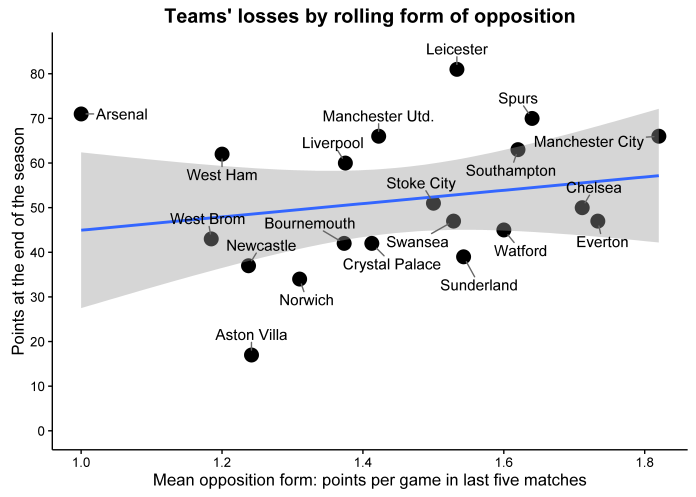
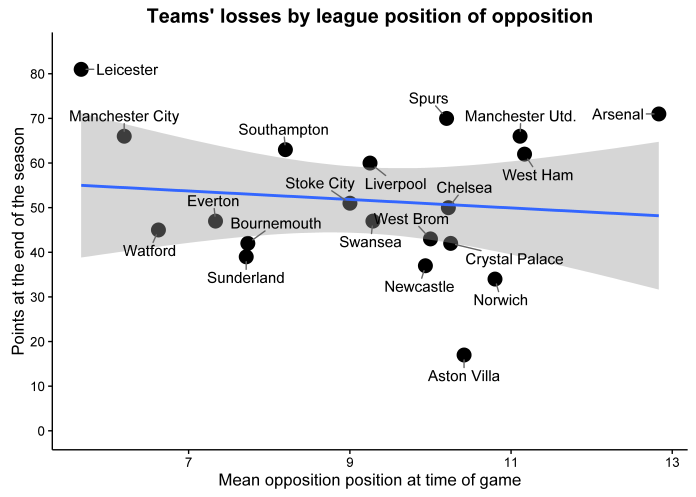
Both these graphs show a slight relationship between how well a team did overall and the nature of their losses – the better performing teams tended to lose to better opposition, i.e., by losing to teams with higher points per game in the last five games and teams who were higher in the table at the time.
All except Arsenal. In fact, Arsenal were the worst team least season in terms of losing to teams in poor form. The teams that Arsenal lost to were in the worst average form and in the lowest average position compared with losses by any other team in the league.
In short, this contradicts the main narrative of Arsenal not being good enough against the top teams. Rather, Arsenal aren’t good enough against the bad teams, and lost out on the league by losing to teams in poor form in the relegation zone. Next time Arsenal play a poorly-performing bottom-table team, maybe a Hull or a Middlesborough in a bit of a rut, I’ll stick a tenner on Arsenal to lose; they’re only a little less likely to lose than they are to win.


i feel good
LikeLike