
Apologies, it’s taken me far too long to get round to writing this.
A little while ago, I set up a quiz to see whether people could accurately guess whether a spatially-plotted league table was from the Premier League or La Liga. The idea was to see if the (British) stereotype of the Premier League being competitive and La Liga being Barcelona and Real Madrid plus eighteen others was born out by the league tables. I did this because I’m pretty bored of reading comments like this:
“Right, yeah, English teams are bobbins in the Champions League because the Premier League might not have the highest quality, but it’s the best league in the world because of the competition and how close all the teams are. You never know who’s going to win it! It’s not like in Spain, where it’s always going to be Barcelona or Real Madrid winning it by a mile, and all the other teams don’t even matter.”
According to this stereotype, a spatial dotplot of the Premier League would look like this:

…while a spatial dotplot of La Liga would look like this:

So, I did what any reasonable person would do; I scraped a load of data, visualised the league tables as dotplots in random order, and created an online quiz to see if people could guess which league was which. If the differences between the two leagues are obvious, it should be easy enough to tell which league is which from a dotplot. The rest of this blog is basically a love letter to ggplot2.
People saw graphs like this, and simply had to say whether it was La Liga – Premier League or Premier League – La Liga:

In this case, La Liga is on the left, and the Premier League is on the right. It’s the 2008-09 season, when Barcelona finished nine points ahead of Real Madrid and Manchester United finished four points ahead of Liverpool. The position of the league on the x-axis was shuffled, so that each league was on the left side and the right side five times each, and the questions were presented to people in a random order.
172 people did the quiz, and scored an average of 62%.
The most well-answered question was the 2011-12 season, where 74% of people correctly answered that La Liga is on the left and the Premier League is on the right:

…and the least well-answered question was the 2006-07 season, where only 35% of people correctly answered that La Liga is on the left and the Premier League is on the right:

This wasn’t a perfect psychology experiment. People doing the quiz already knew what it was about and were aware that I was looking into the stereotype, but it is a useful demonstration that it’s not easy to guess which league is which. Perhaps the stereotype isn’t entirely accurate. Indeed, if we take the ten seasons in the quiz plus the season just finished and do some descriptive statistics, the mean number of points in the Premier League is 52.1 and the mean number of points in La Liga is 52.4. while the standard deviation of points is 17.0 in the Premier League and 16.3 in La Liga. This would suggest that there’s no real difference in how widely the points are spread across the teams.
However, there might be a general trend when we look at all of them put together. If we take the ten seasons in the quiz, plus the season just finished, and plot the number of points per position per season, we get this graph:
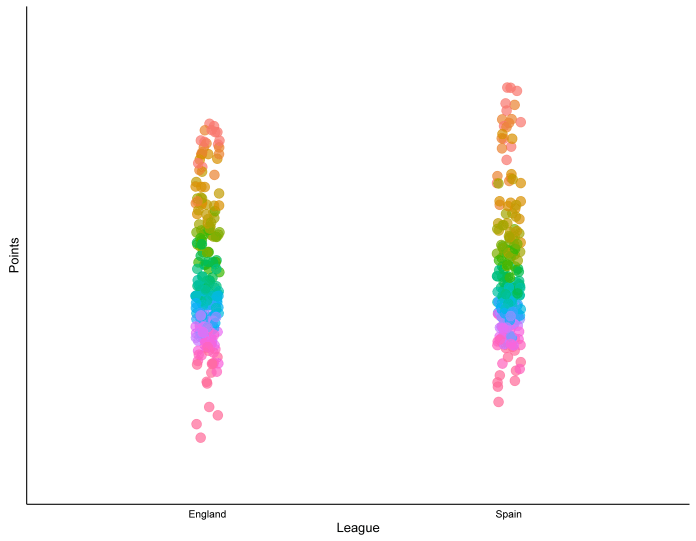
This actually does suggest that there may be something in the stereotype of the top teams in La Liga pulling away from the rest of the league. The dots at the top of the league are stretched higher than they are in the Premier League.
Similarly, we can look at the mean number of points per position in the last 11 seasons:
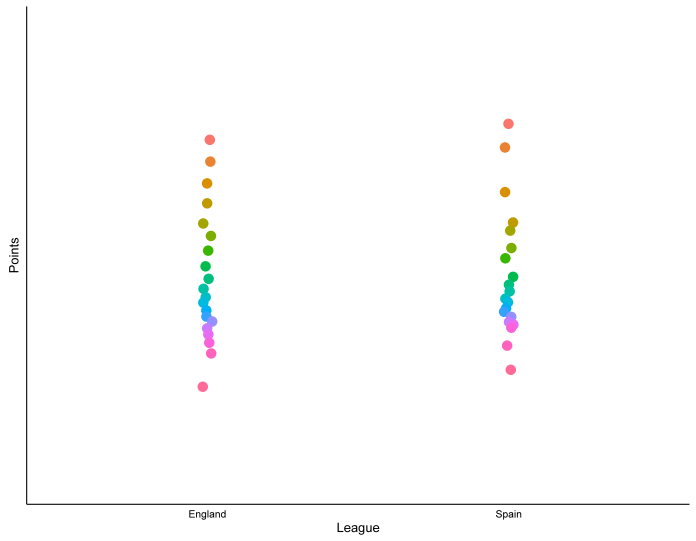
…and this also seems to show that the top teams in La Liga are spread out a bit further than the top teams in the Premier League.
Sure enough, when we look at the stats for the top four teams, it shows a bit more spread; the mean number of points for the top four teams is very similar – 78.4 in the Premier League, 78.1 in La Liga – but the standard deviation is 8.2 in the Premier League and 12.1 in La Liga.
One last thing we can look at plotting is goal difference. Here’s the goal difference per position for each of the last 11 seasons (a goal difference of 0 is shown by the horizontal black line):
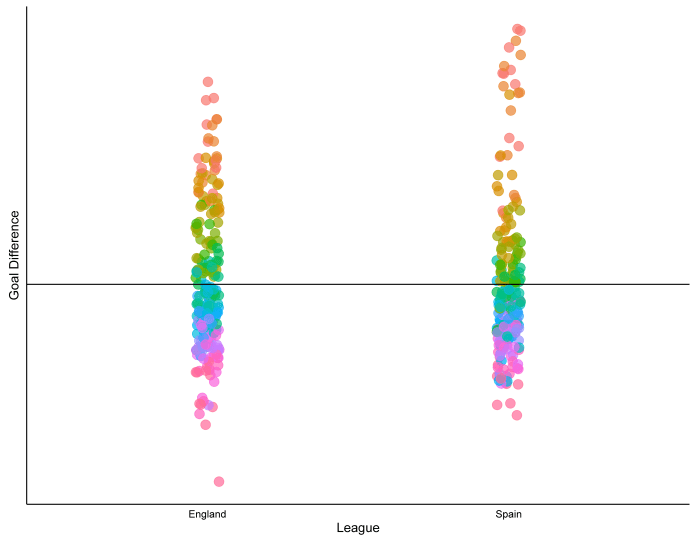
Again, the top teams in Spain seem to be more spread out compared to the rest of the league than the top teams in England are. In fact, when we average it together for the last 11 seasons, we get this:
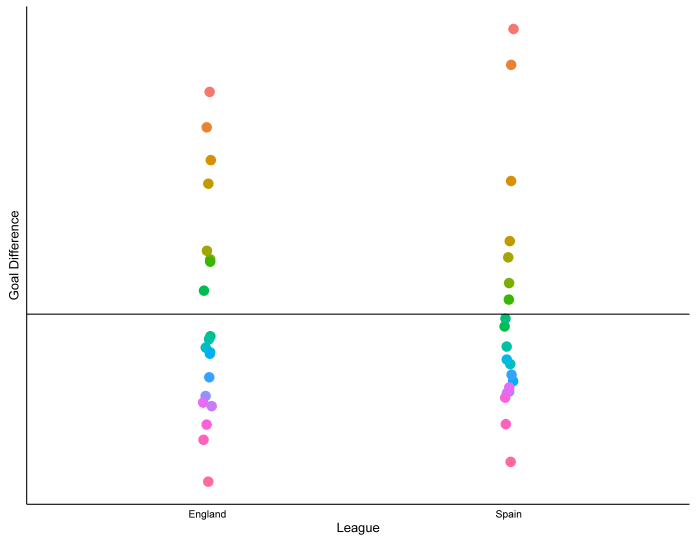
…which shows that, on average, the second-placed team in La Liga generally has a better goal difference than the winner of the Premier League (57.6 to 51.4), but that the third-placed team in La Liga generally has the same goal difference as the fourth-placed team in the Premier League (30.8 and 30.2 respectively).
How about combining these graphs, with points up the y-axis and goal difference denoted by dot size?

It seems that, on average, there may be some truth in the stereotype. The top two teams in La Liga dominate their competitors, both in terms of points and goal difference, whereas there seems to be less separating the top teams in the Premier League.
…and just for bonus points, let’s do the same thing for the top five European leagues over the last 11 seasons. This time it’s done by points per game rather than points, as the Bundesliga only has 18 teams:

It looks like the Premiership does have the most competitive title race after all.
