

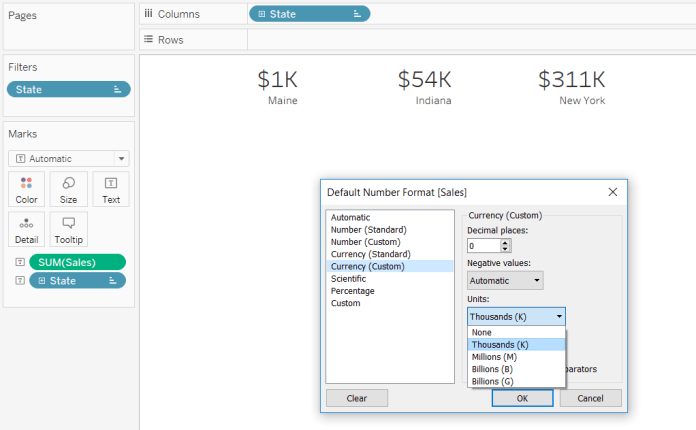
Lots of Tableau dashboards feature big summary numbers. They’re pretty nice, and they look like this:

And what’s even nicer is that you can alter the measure’s default number format to automatically round a specific unit, like this:
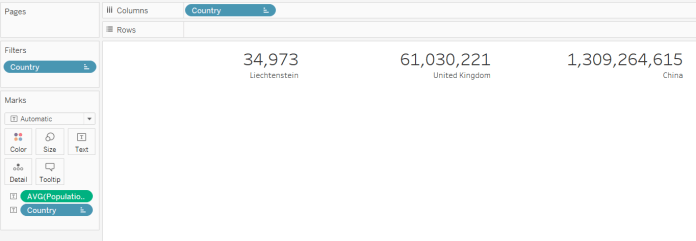
But sometimes, the range of numbers is a lot wider than sales per state in Superstore. Let’s have a look at population per country in the World Indicators dataset:
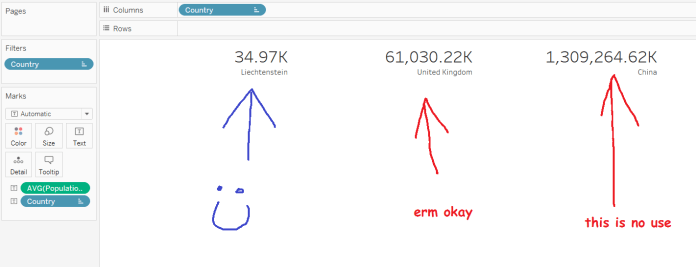
Those are some long numbers, so let’s round them to the nearest unit again. But which one? If we round to the thousands, we get this:
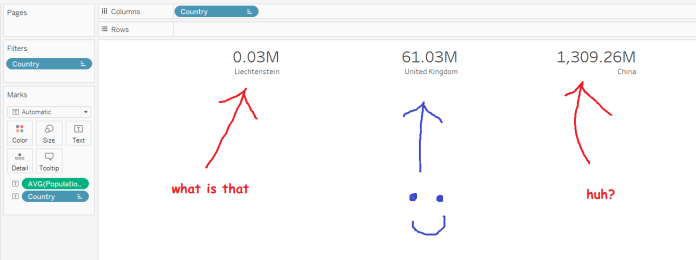
And if we round to the millions, we get this:
It’d be great if we could get Tableau to figure out what the nearest sensible unit is. That functionality doesn’t exist yet (as far as I know!), but we can write a specific optimised rounding calculation for labelling purposes. It’s a bit of a long one:
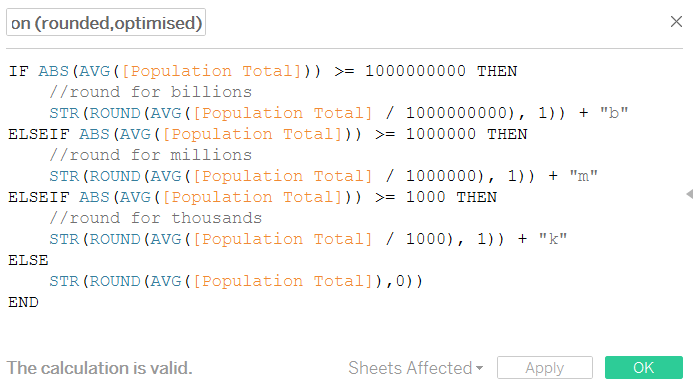
This calculation returns the number you want as a string. It does this by:
- Aggregating the number you’re actually working with already and finding out whether it’s above a billion (in which case you’d want to summarise to whatever number of billions it is), or above a million (in which case you’d want to summarise to whatever number of millions it is), and so on.
- Converting it to an absolute number so that it works for negative numbers too.
- Taking that aggregated number and dividing by the sensible unit. For example, if your number is 34000000, you’d want to express it as 34 million, so we’re dividing it by a million to return 34.
- Rounding that divided figure to one decimal place. This is just my preference, you can do what you like! Set the number to 0 for no decimal places, or 2 for two decimal places, etc.
- Convert that number to a string.
- Add a text unit abbreviation to the end of it.
Of course, you can also add trillions, quadrillions, and so on, if that’s what your data requires.
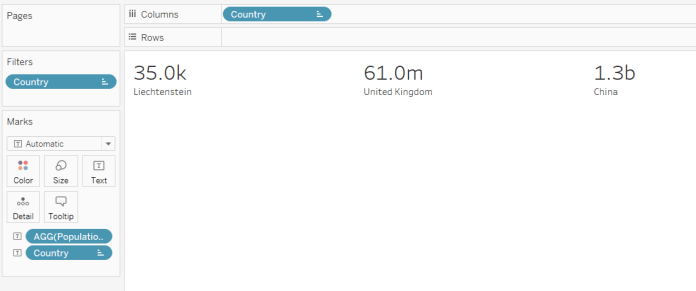
This sorts us out nicely:
Now, I’ve deliberately aggregated everything within the calculation, and I’m only using it for labelling purposes. I categorically do not recommend aggregating outside this calculation or using this calculation for calculating anything else. This will result in a shitstorm of rounding errors which can seriously damage your data. But as a final step once you’ve sorted everything out, I find that this is really nice for presenting data.
Here’s the calculation in text so you can copy and paste it into your workbooks:
IF ABS(AVG([Population Total])) >= 1000000000 THEN

//round for billions

STR(ROUND(AVG([Population Total] / 1000000000), 1)) + "b"

ELSEIF ABS(AVG([Population Total])) >= 1000000 THEN

//round for millions

STR(ROUND(AVG([Population Total] / 1000000), 1)) + "m"

ELSEIF ABS(AVG([Population Total])) >= 1000 THEN

//round for thousands

STR(ROUND(AVG([Population Total] / 1000), 1)) + "k"

ELSE

STR(ROUND(AVG([Population Total]),0))

END
