

Here’s a quick Tableau tip I’ve used a fair bit lately. It’s a really simple one but I haven’t seen it blogged about before – apologies if you’ve written about it and I’ve unintentionally ripped you off.
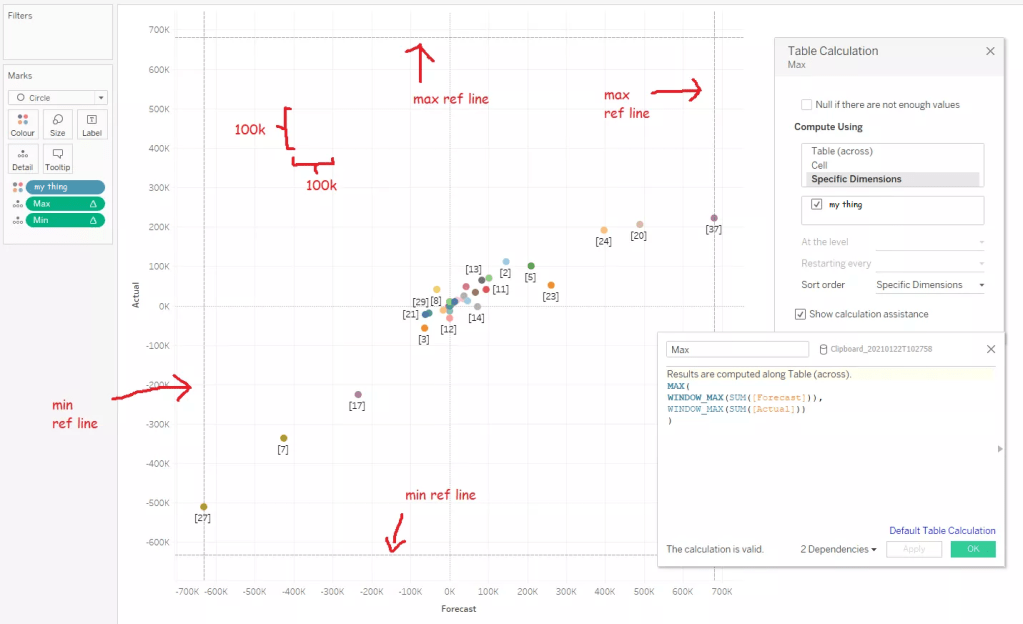
When Tableau creates a scatterplot, it automatically sizes the axes to the extent of the data. That’s often exactly how I want it to look, but sometimes, it’s not. For example, in this situation, I’m comparing a forecast I made with the actuals, and the different axis scaling makes my forecast look better than it is:

I want to get around that – instead of Tableau fitting the two axis scales to the data available, I want to force Tableau to fit the two axis scales to fit each other, giving me an equal scale on both axes. I can do this with two calculations and four reference lines, which is a little more effort than just fixing my axes, but it’s also a lot more robust than fixing my axes, which isn’t dynamic.
The calcs are as follows.
Max calculation:
MAX([
WINDOW_MAX(SUM([Forecast])),
WINDOW_MAX(SUM(Actual]))
)
Min calculation:
MIN(
WINDOW_MIN(SUM([Forecast])),
WINDOW_MIN(SUM([Actual]))
)
The max calc finds the window_max of the measures on each axis, and then finds the max of that. In my case, this is SUM([Forecast]) and SUM([Actual]), which you can switch out for whatever your measure is. Basically, it means “what’s the point with the highest value on either axis?”. The min calc does the same thing but with the min of the two window_mins.
That returns the highest and lowest value across both axes. You can then put those on each axis as four reference lines – take the max of the max calc and the min of the min calc on each axis – and then make the reference lines invisible.
And that’s it! A perfectly square scatterplot with the same scale on both axes. If you’re putting it in a dashboard, make sure to fix the sheet size so that it’s square there too.
