
Tableau’s colour palettes are generally pretty good, pretty flexible, and pretty… well, pretty. But sometimes you want to colour-code a dimension with more values than the number of colours in the palette, and this is when Tableau has a bit of a problem.
This blog is about how Tableau assigns colours, how that messes some things up, and how to get around that.
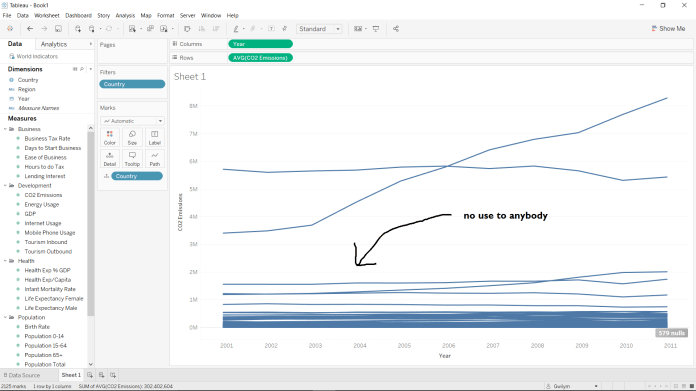
I’m working with the Global Indicators dataset in Tableau 10.2 here. Let’s say I want to plot each country’s CO2 emissions each year. Without using colours at all, we get this:
Not exactly ideal, so I’ll put the Country dimension on the colour shelf. But before I do, I’m just going to take the CO2 Emissions measure off the view so that we can see how Tableau assigns colours to values in a dimension:
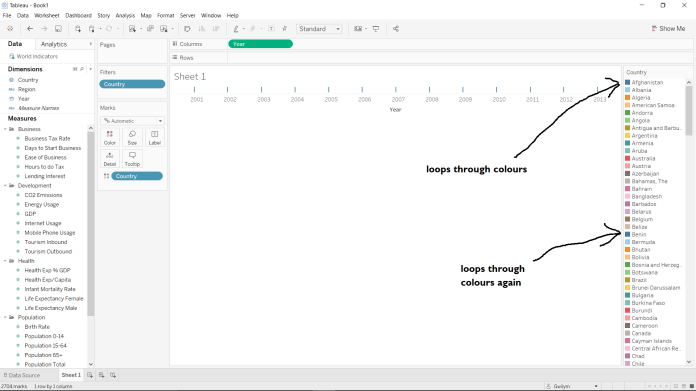
Tableau takes all values in the dimension in order, and loops through the colour palette (in this case the 20-shaded automatic palette), assigning the colours in order and restarting every 20 values.
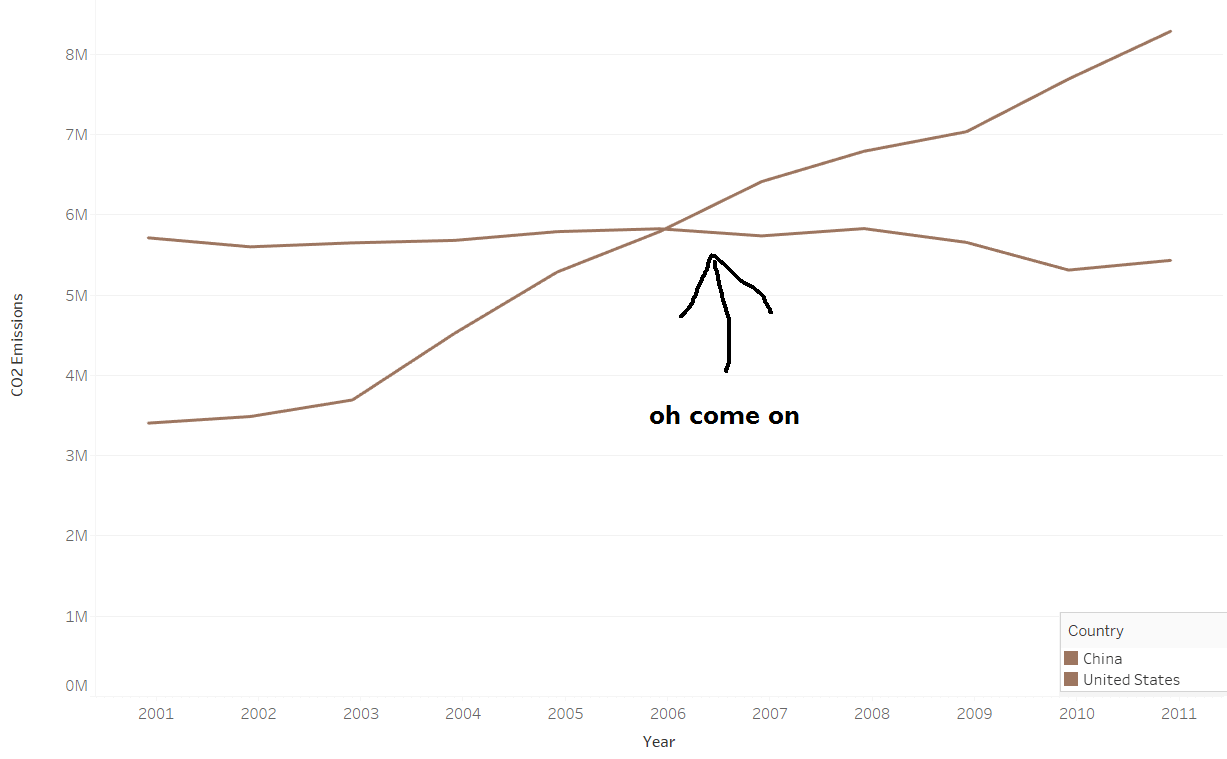
As there are about 200 countries but only 20 colours, ten or so countries will be represented by the same colour. This might not be a problem, depending on what we’re plotting, but then again, it might. Let’s put the CO2 Emissions measure back into the view:
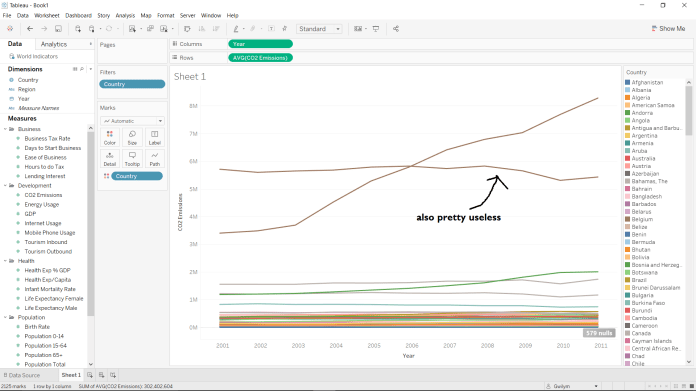
Yeah, it’s a problem. It just so happens that China and the USA are a multiple of 20 apart in the dimension list, so they’ve been assigned the same brown colour. This is a problem.
Even more irritatingly, Tableau assigns the colour palette to all possible values in the dimension before you filter them. So, if I change the filter so that it only has China and the USA…
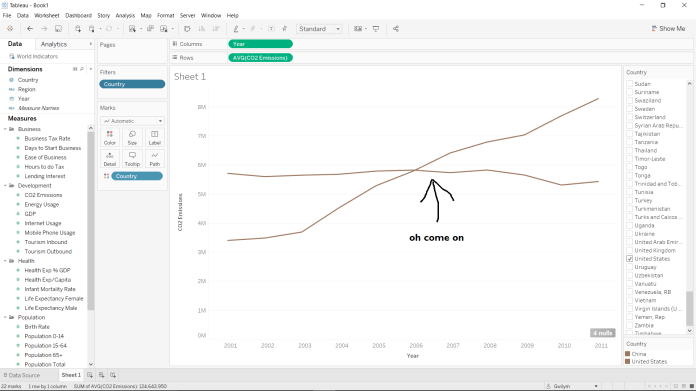
…they’re still the same colour.
How can we assign colours to only the countries selected by the filter in the view, rather than all countries?
One solution (thanks Anna for the tip!) is to create a calculated Rank() field, which will only look at the countries in the view. I’ll stick with a default rank of the countries themselves for now, which will do it alphabetically, but you can also do it by how they do on a particular measure.

Make this new calculated field discrete, and drag it onto the colour shelf. You’ll also need to separate out the countries by putting Country on detail (which was previously done automatically when Country was on colour).

This has changed the colours… but they’re still the same. This is because Rank() is a table calculation, and we need to change its default settings. Instead of compute using Table (across), compute using Country:

This now ranks the countries alphabetically (in reverse order, but it doesn’t really matter for this purpose) and assigns a different colour to each of them:
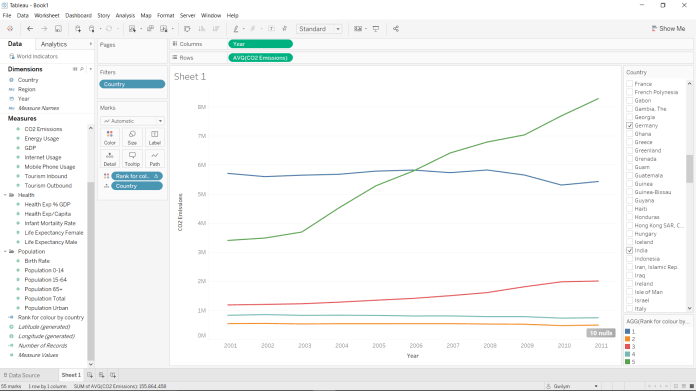
Now we have nicely distinguishable colours for dimensions with loads of values when we actually only want to plot a handful!
The colour marks card is a bit annoying, though; it only shows the rank number next to the colour, not the country name. You can get around this by creating a new sheet, applying the country filter to that sheet too, and just putting Country in rows:

You can now use this second sheet as a colour legend in a dashboard.
Of course, you might suggest that a simpler solution to the colour problem is to forget about colours altogether and just use labels on the lines. And you’d be totally correct! But maybe you’ve got a more complicated plot where you’ve got several different values for the same country or something. Like a scatterplot of two measures with a circle for each year:

Labels would look pretty hideous on this, especially if the circles overlapped a lot. But the Rank() colour workaround still applies.
