

I love sentiment analysis. It’s a great way of getting fascinating insights from a glut of text data. You can take a load of Yelp reviews, figure out how people feel about a place, and cross-validate it with the star rating. You can take the works of Jane Austen and plot narrative arcs. You can look at the texting styles of you and your girlfriend. If you’ve got a dataset with clear sentences in standard textbook English, you can find out all sorts of things.
But, here’s the thing with language; it’s gloriously, infuriatingly messy.
That makes it really hard to do really good sentiment analysis – certainly with the free, widely-available tools. Most of those assign certain emotional values to specific words; for example, in the NRC dataset often used with the R package Tidytext, the word “alive” has associations of ANTICIPATION, JOY, POSITIVE, and TRUST, while the word “afraid” has associations of FEAR and NEGATIVE.
This approach works great for sentences like this:
“I bought these shoes last week, and they’re amazing. They feel great, and they make me feel great. Good value too! 10/10, very happy about this.”
…but it doesn’t work for sentences like this:
“I don’t feel good about this. I don’t feel good about this at all. I’d love to get out of this situation right now.”
The second sentence is pretty obviously negative, but it works by negating words. The word “good” isn’t actually good, because it’s being negated by “don’t” a couple of words earlier. And “love” isn’t a positive emotion here, as it’s expressing the desire to get out of the situation, meaning that what’s going on is not a positive thing.
It’s possible to address this with sentiment analysis, but it’s complicated. You’d have to account for every possible way of negating/reversing a word, and there’s a lot of those. You’d have to account for every possible way that a word that’s positive in isolation could actually be referring to a negative overall situation, and that’s a huge task. This is why good sentiment analysis costs a fortune. It’s really complicated.
Luckily, people tend not to speak indirectly all the time, and in aggregate, the twisting, sentiment-negating sentences are cancelled out by the number of straightforward sentences where word-level sentiment analysis does work. But the caveat is that just because you’re using sentiment analysis, that doesn’t mean you’re using it well, and you should really cross-validate it with some other measures.
I’m exploring this with lyrics from Brian Fallon’s bands – The Gaslight Anthem, The Horrible Crowes, and his solo project. I’m looking at Fallon’s lyrics because:
- Song lyrics are enough of a deviation from standard English to pose problems for standard sentiment analysis;
- At the same time, song lyrics are some of the most obviously emotional usages of language we have;
- Fallon writes lyrics in a pretty clear style, often in full sentences, without too many obscure metaphors or references;
- I really like his music.
I’ve used the Tidytext package in R for doing sentiment analysis before. This time, I’m using the same NRC sentiment dataset, but trying it out in Alteryx instead. I’ve also visualised it in Tableau, and you can click any of these images to go to an interactive link where you can play around with it yourself.
So, first things first; let’s have a look at sentiment in each song:

Looks pretty good so far. Here’s lookin’ at you, kid is a wistful, regretful song; definitely on the negative side, quite a bit of sadness, very little joy. Click the graph to explore other Brian Fallon songs, if you know them.
There’s a lot of different sentiment measures available, so let’s simplify it to looking at positive and negative. Here’s lookin’ at you, kid has 13 negative words, and 4 positive words. If we take difference (9) and divide it by the biggest value (13), we get a ratio of positive to negative words:
Positive – Negative
————————————
MAX(Positive, Negative)
This accounts for the difference between positive and negative words, as well as the number. For example, if one song has 10 positive words and 5 negative words, and another song has 6 positive words and 1 negative word, the difference is the same, but the second song is more positive overall, because it has far more times the number of positive words than negative words.
If we calculate this +/- balance for each song, we can order them as follows:
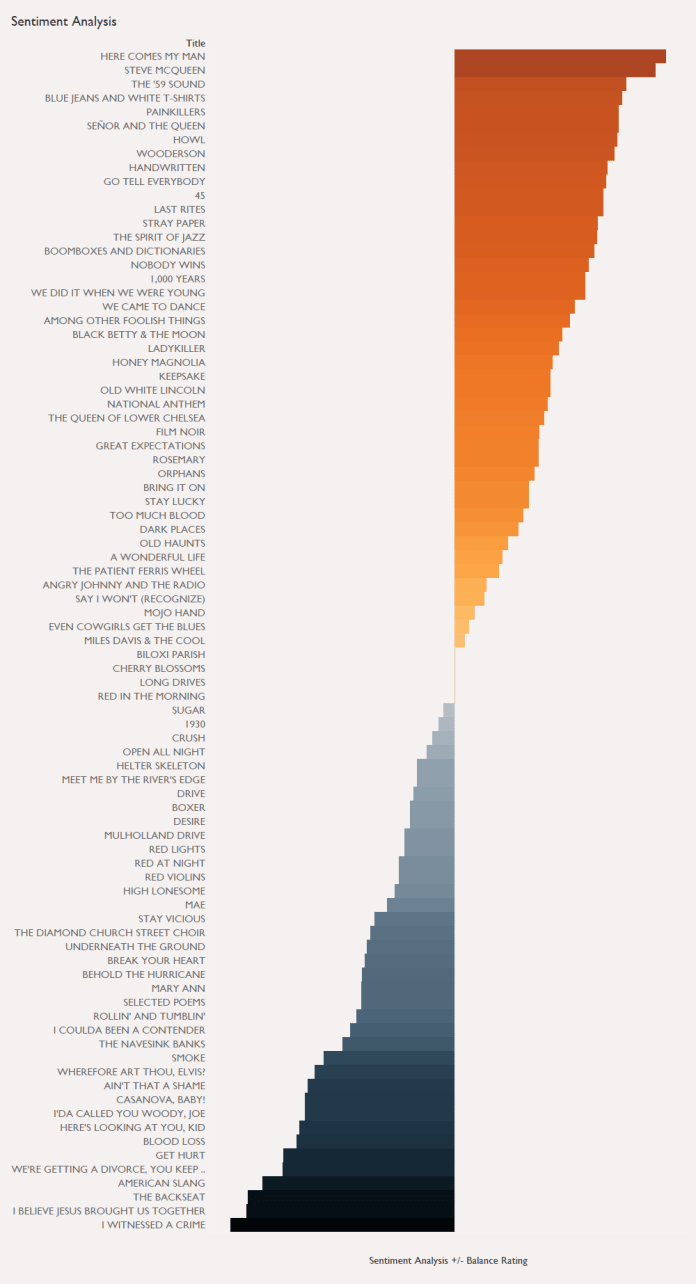
There’s a nice mix of positive and negative songs, and if you know the songs, some of them definitely feel right; Here’s lookin’ at you, kid is negative, so is Get hurt, while 45 is an upbeat, positive song. But there’s definitely some weird ones in there. We did it when we were young is a sad, regretful song, but it’s up there in the top half of positive songs. That doesn’t seem right.
So let’s cross-validate this. Spotify’s Echo Nest data has a measure called Valence, which is a measure of how positive the mood of a song is. You can get all kinds of interesting measures for your Spotify playlist here. When we plot the Spotify Valence (branching off to the left for values under 50), we get this instead:

Spotify has Here’s lookin’ at you, kid as one of the most negative songs, along with Cherry blossoms, which seems about right to me, but has We did it when we were young as a pretty neutral song, which still doesn’t feel right. Have a look at the difference with Blue jeans and white t-shirts, as well – it’s one of the most negative songs according to Spotify, but one of the most positive according to sentiment analysis. I’d put it somewhere in the middle, maybe a bit more positive than neutral.
Since I keep using my own perspective as a fan and a human, I figured I’d better cross-validate both of these stats with what fans think. I set up a simple survey where to get Brian Fallon fans to rate each song for positivity on a scale of 1 to 7, where 1 meant really negative, 4 meant neutral, and 7 meant really positive. I stressed in the introduction, several times, that it’s not a rating of how much you like each song, or how positive each song makes you personally feel (like, I really like Fallon’s sad songs because they make me feel nice… but they’re still objectively sad), but about the emotion in the song itself. Around 15-20 fans answered for each song, so I averaged their ratings together to get a human-generated emotion rating per song. It’s not the most scientific approach, but it’s good enough for the purposes of this blog.
Here’s what we get, centred around an average of 4 for neutral songs:
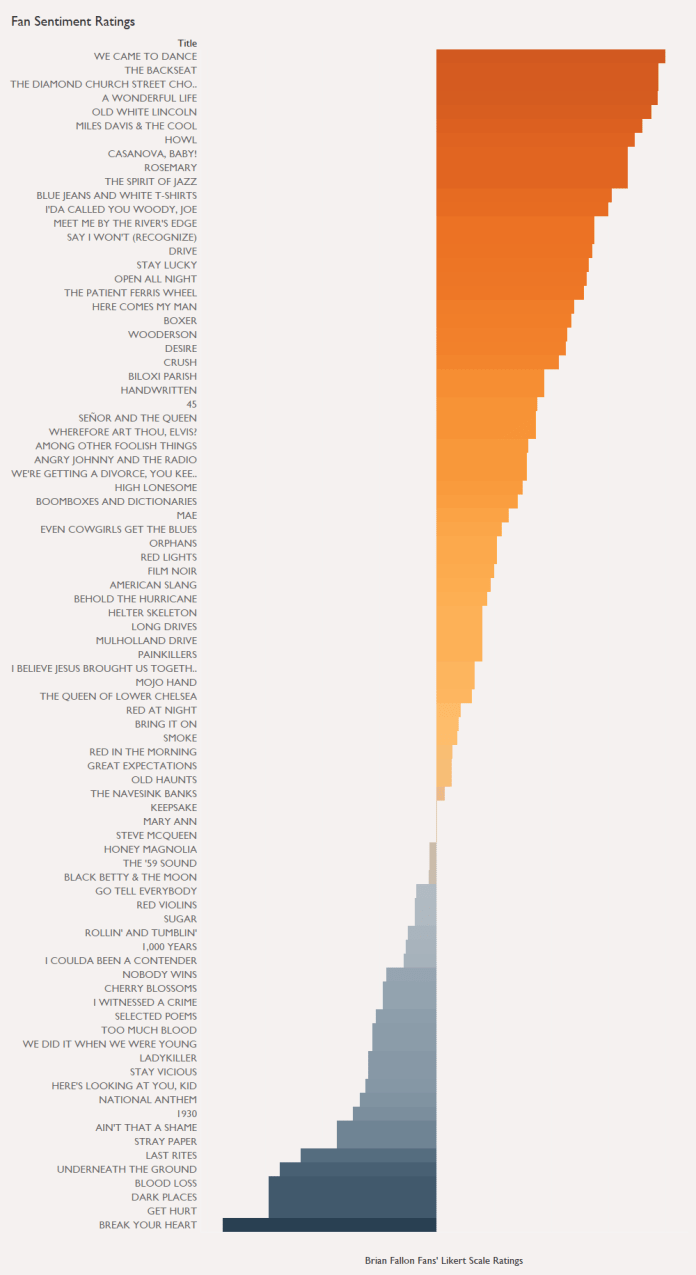
This time, Blue jeans and white t-shirts comes in as I see it – fairly positive, but not hugely so. We did it when we were young is down there in the negative range, along with Get hurt and Here’s lookin’ at you, kid.
It’s fascinating to see how the three measures agree and disagree for each song. If we rank each song along each measure (with 1 being most positive and 85 being most negative), we can see how the rank difference varies. There are five possible combinations:
- All measures disagree with each other
- All measures agree with each other
- Spotify valence and fan rating agree, but sentiment analysis disagrees
- Sentiment analysis and fan rating agree, but Spotify valence disagrees
- Sentiment analysis and Spotify valence agree, but fan rating disagrees
…and there’s at least one example of each:

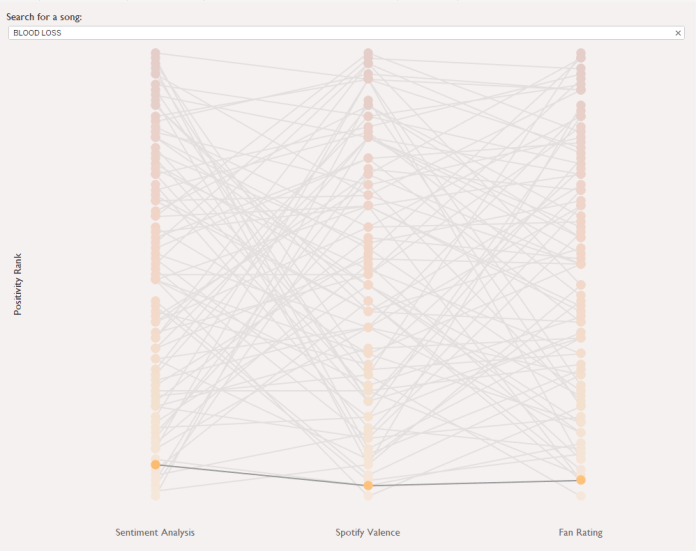
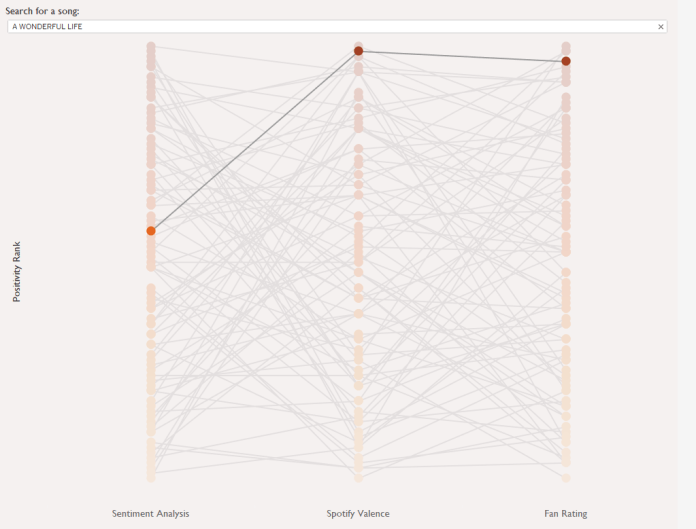
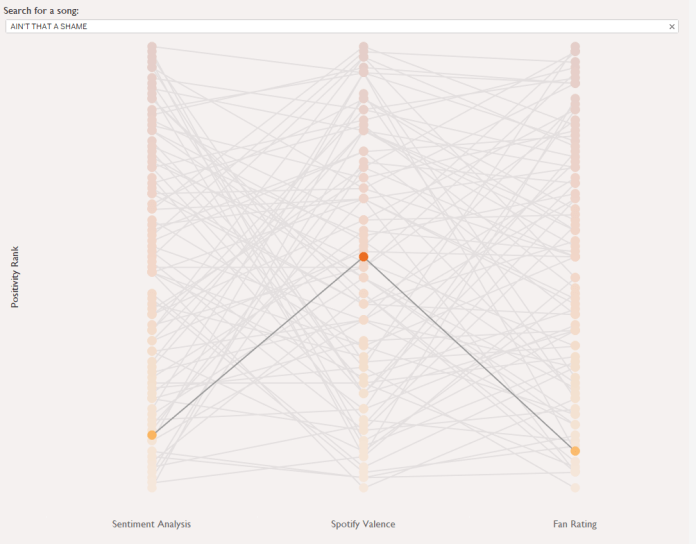

We can see which songs are most consistently rated across all three measures by looking at the difference between each song’s highest and lowest positivity rank:

Blood loss is the most consistently rated, with a rank difference of only four places, while The backseat has a massive rank difference of 81 – fans put it as the second most positive song in Brian Fallon’s catalogue, while sentiment analysis rates it as 83rd, ahead of only I believe Jesus brought us together and I witnessed a crime. Spotify puts it at 24th.
Another way of showing this variation is by creating scatterplots of each measure against each other, with each dot representing a song:
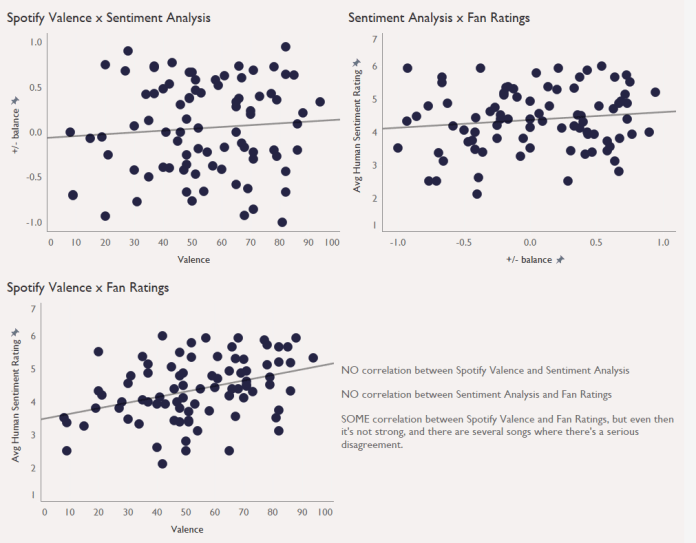
I’ve run simple correlations on each plot – not exactly statistically kosher, but this is all just exploratory. There is no correlation between valence and sentiment analysis, and more tellingly, no correlation between sentiment analysis and fan ratings. There is a correlation between valence and fan ratings, but it’s not particularly strong.
The overall point, then, is to be careful with sentiment analysis. It’s not that it doesn’t work – it can often work really well, and be a really useful line of investigating data. But relying on sentiment analysis alone, without checking whether it matches measures that should reflect the same kind of thing, might give you some false insights. You don’t want to have Great expectations, or you might Get hurt.
